Data Visualization Software Marketing Turn “chart maker” searches into trials & published charts.
SearchPod runs the site, Google Ads, SEO, AI search, and onboarding email for chart and data-viz tools.
- Google Ads aimed at comms teams and developers already comparing you to Datawrapper, Flourish, or a charting library
- A live, published chart gallery and plain pricing that make starting a free trial an easy yes
- Every trial traced back to the exact search or campaign that produced it, so you always know your real cost per customer
Prefer to talk? (519) 930-8818 — a strategist, not a sales script.

-
Found you comparing tools
Searched “chart maker” or “infogram alternatives”
-
Started a free trial
Imported a spreadsheet, picked a chart type
-
Became a paying customer
Publishing and embedding charts every week
One team. Two buyers, one system.
- Website
- Paid Acquisition
- SEO & Content
- AI Search
- Lifecycle Email
- Reviews
- of your ad budget is our whole Google Ads fee
- 10% of your ad budget is our whole Google Ads fee $600/month minimum, and your ad budget goes to Google in full — we add no markup.
- setup fees, month to month
- $0 setup fees, month to month No contract and nothing to buy in. If we're not a fit, you can leave any month.
- you-don't-pay guarantee
- 30 days you-don't-pay guarantee If you're not happy with your first 30 days, you don't pay. That's the whole policy.
These numbers are real — you'll find the same figures on our pricing page.
Why Growth Stalls
Two very different buyers, and neither one finds you by accident.
A chart tool your users love still has to out-rank Datawrapper, Flourish, and every BI suite it gets mistaken for.
-
A trial opens, builds one test chart, and never gets published
Most evaluations start the same way: import a sample spreadsheet, pick a chart type, and stop.
-
Buyers think you're either a toy or a full BI suite
Someone searching “data visualization software” lands expecting a bar-chart-only toy or a warehouse-grade platform like Tableau or Power BI.
-
Journalists and comms teams can't tell if this fits their workflow
A reporter on deadline or a comms manager building a board deck needs to know, fast, whether they can paste in a Google Sheet and get something publishable.
-
Developers can't find your API or embed docs from Google
A product team shopping for a charting library searches for docs, npm packages, and GitHub comparisons before they ever look at your marketing site.
Your growth engine
One pipeline for two buyers, built from five channels that never work in isolation.
-
Website & CRO
Clicks to first charts
-
Paid Acquisition
Google Ads only
-
SEO & Content
Wins “alternatives to” searches
-
AI Search (GEO)
Named ahead of BI suites
-
Lifecycle Email
Trials to published, paying accounts
More trials, published charts & paying customers
Paid Acquisition (PPC)
Paid search for a two-buyer chart-tool funnel. Show up while the tab with Datawrapper is still open.
Google Ads only — we don't spend your budget on LinkedIn for this category — aimed at comms teams and developers running an active comparison, landing pages that open with a live chart gallery instead of a feature list, and every trial mapped back to its real cost.
- Keywords built around real evaluations — “chart maker,” “infogram alternatives,” and your named competitors
- Landing pages that open with a published chart gallery, not a tour of chart types
- Every trial and demo mapped back to the exact keyword that produced it
Sponsored
yourchartapp.com
Turn a Spreadsheet Into a Publish-Ready Chart
Import a CSV or Google Sheet and get a branded, embeddable chart in minutes — no designer, no code. Free trial, no credit card. Export as PNG, SVG, or a responsive embed.
- Pricing
- Free Trial
- Demo
Start free trial
another-chart-tool.com
No-Code Charts With Your Own Brand Colors
-
Chartline
You4.8 4.8 out of 5 stars, · 390 reviews
“Our whole newsroom moved off static images and into live embeds in a week.”
-
Grapholio
4.7 4.7 out of 5 stars, · 310 reviews
“I paste in a Google Sheet and have a publish-ready chart before my coffee's cold.”
-
EmbedKit
4.9 4.9 out of 5 stars, · 455 reviews
“We swapped our old charting library for their API and didn't touch our design system.”
Organic & Marketplace Visibility
Rankings, listings, and launch-community visibility. Show up before someone opens a competitor's tab.
A comms lead compares chart tools on Google and G2; a developer compares them on GitHub, docs, and Product Hunt.
- Rankings for named comparisons — “datawrapper alternatives,” “flourish vs infogram,” and more
- Docs-adjacent and library-comparison pages that win a developer's technical evaluation
- A stronger G2, Capterra, and Product Hunt presence that backs up the site
High-Intent Visibility
What someone types right before they pick a chart tool.
A comms lead searches Google before opening a trial; a developer searches GitHub and doc sites before touching your pricing page.
Page one, for both buyer types
The buying-intent searches comms teams and developers actually run — the ones your pages, ads, and docs need to win.
- best data visualization software
- datawrapper alternatives
- flourish vs infogram
- no-code chart maker for reports
- data visualization tool for journalists
- embeddable chart library for web apps
- chart.js vs highcharts
- infogram pricing
- interactive map maker online
- chart maker free trial
- best tool to turn a spreadsheet into a chart
- embeddable dashboard api
Google Search · Bing Search
Recommended by AI search
The kind of question a comms lead or developer asks an AI assistant before they ever open your homepage.
- “What's the easiest free tool to turn a spreadsheet into a chart for an article?”
- “Best no-code alternative to Datawrapper for a small comms team?”
- “Which charting library should I use to embed interactive charts in my own app?”
- “What's the best tool for a newsroom to build maps and interactive graphics?”
- “Recommend a chart maker that keeps our brand fonts and colors.”
Google Gemini · ChatGPT · Claude (Anthropic) · Google AI Overviews · Perplexity
These are samples — your real list is built around your named competitors and how your two buyer types actually search. Expect rankings to build over 3–4 months, with steady organic leads by month 6 to 8.
Lifecycle Email
Email built around one moment: a published chart. Not just a signup — a chart someone actually ships.
A trial that already signed up costs you nothing more to convert.
- Onboarding built around one real chart getting published or embedded, not a tour of chart types
- A nudge timed to exactly when a trial goes quiet, before the evaluation goes cold
- Upgrade email that turns a single published chart into a team-wide, renewing account
-
Welcome — let's publish your first chart
Your workspace is ready. Import a spreadsheet and pick a chart type to get started.
Onboarding -
One click from your first embed
Your chart's ready — here's the embed code to drop it into your site or CMS.
Activation -
Your trial ends Friday — keep every chart live
Lock in a plan now so your published charts and embeds don't go dark.
Upgrade
Proof, not promises
See exactly which search turns into a published chart.
One dashboard connects every campaign to trials, published charts, and paying accounts.
Pipeline & Trials From a search to a tracked trial
Every trial is tagged the moment it signs up — which search, which ad, which comparison page — and lands in your CRM before anyone has to ask.
Every trial traced to its source
See whether a signup came from a “chart maker” ad, an organic “alternatives to” page, or a G2 listing.
Synced to your CRM automatically
Trials and demo requests land in HubSpot or Salesforce the moment they're created, so a comms-team signup and a developer signup both show up in the same pipeline.
CAC & LTV What a paying account actually costs
Every paying account is tied back to the campaign or keyword that produced it, so you see a true CAC, payback period, and LTV split by channel.
Real cost per paying account
Ad spend, trials, and conversions tied together in one number.
LTV split by buyer type
Comms-team accounts and developer/embed accounts are tracked as separate lines, so you can see which one brings customers who stay, upgrade, and add seats.
Activation & Conversion Fix the gap between signup and shipped
Most revenue in this category is decided between signup and one real, finished chart.
Activation, defined by a real chart
See how many trials get past a test chart to something they'd actually publish or embed — and which onboarding email moves that number.
Every trial followed to its outcome
Each trial is tracked through to paid or lost, so you know which campaigns and emails produce accounts that stick.
Our work
Six live sample sites. Yours gets a design all its own.
Samples from other niches
-
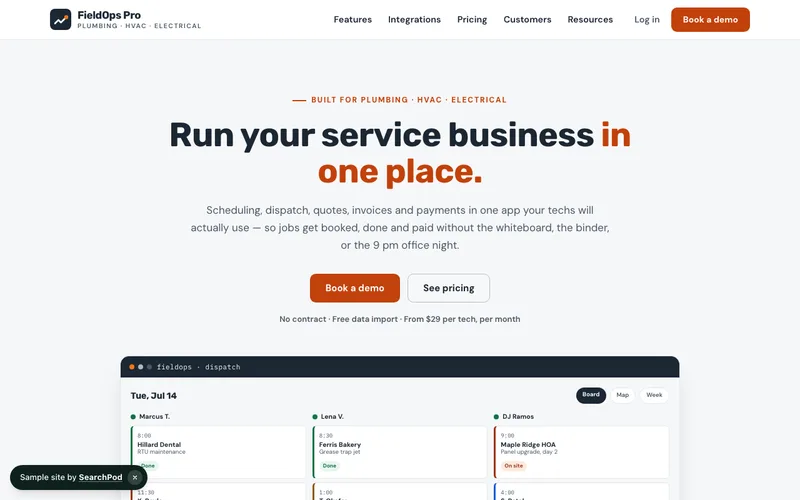
FieldOps Pro
Run your service business in one place · SaaS
Open the live demo → -
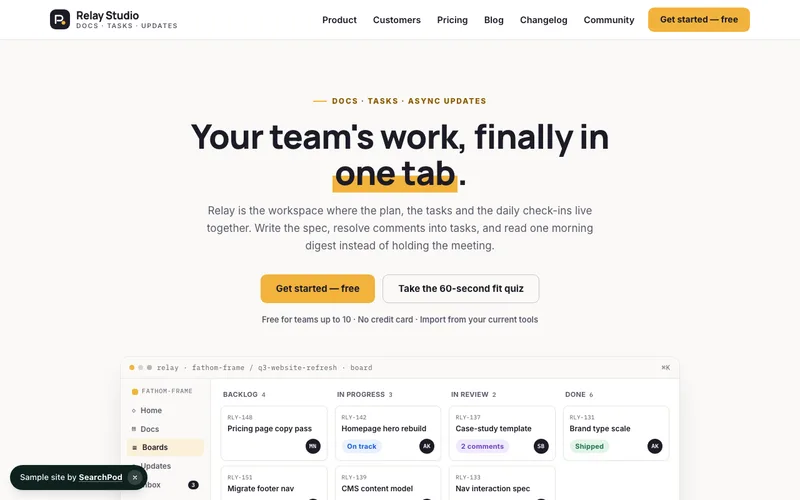
Relay Studio
Where teams ship faster · SaaS
Open the live demo → -
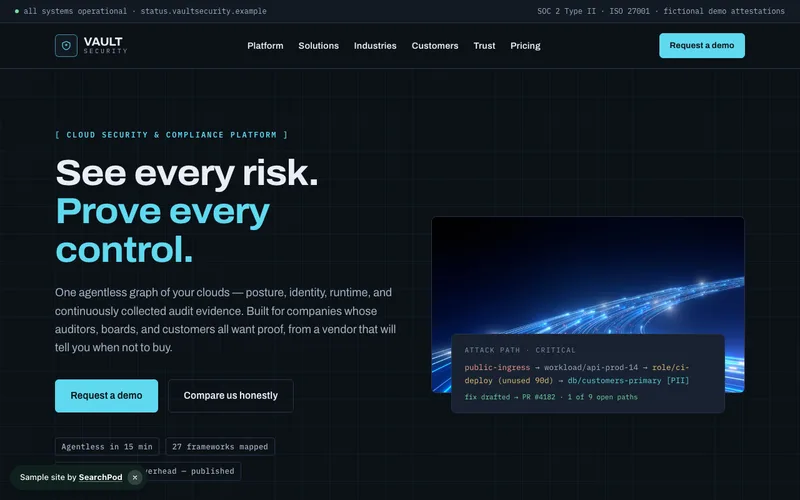
Vault Security
Enterprise-grade security, SOC 2 ready · SaaS
Open the live demo → -
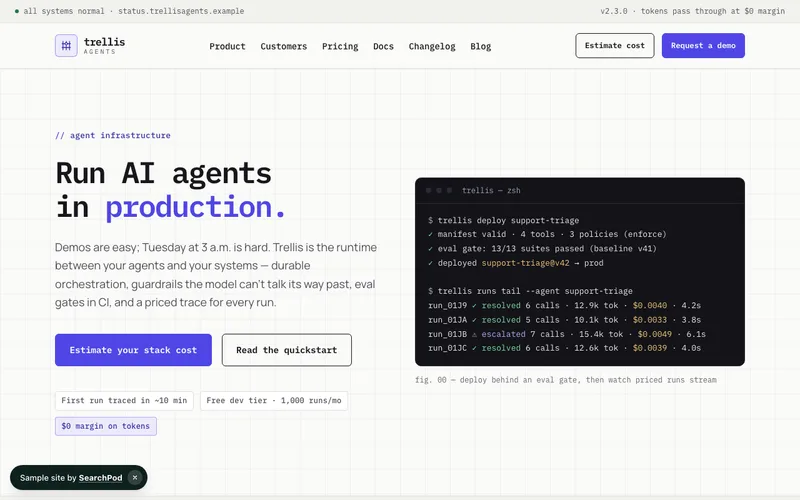
Trellis Agents
Run AI agents in production · SaaS
Open the live demo → -

Cornerstone Capital
Fiduciary planning across generations · Finance
Open the live demo → -
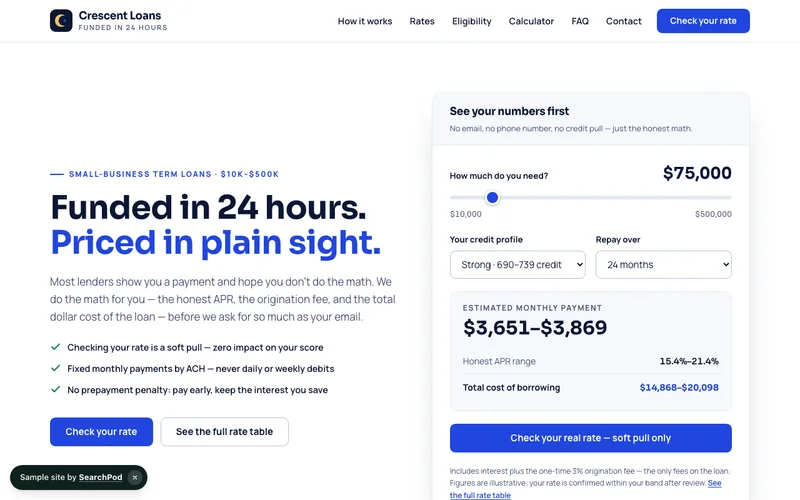
Crescent Loans
Funded in 24 hours · Finance
Open the live demo →
Straight answers
Marketing for data visualization software, without the mystery
It's public, not a mystery quote. Google Ads management runs 10% of whatever you spend on ads, $600/month minimum, and 100% of your ad budget still goes to Google — we don't mark it up. SEO runs $50 per page, 10-page minimum. A custom site or landing-page build is one of eight one-time packages, $1,500 to $20,000+ (full list at /websites). No setup fee, month-to-month, and a scoped, priced proposal lands in your inbox within one business day.
If trials keep building one test chart and stalling, if buyers keep assuming you're either a toy or a warehouse-grade BI platform, or if your only real channel is Product Hunt launches and word of mouth, an agency earns its fee by fixing any one of those. We build the pages, run the ads and SEO, and write the onboarding email that gets a chart published — so your team stays on the product. If trials already convert well without help, don't add a vendor for the sake of it.
It owns the pages that show a real, published chart gallery instead of a feature list, the Google campaigns aimed at comms teams and developers actively comparing tools, the SEO that wins Datawrapper- and Flourish-adjacent searches, and the onboarding email that gets a signup to a finished chart or embed. One team, one pipeline, one number to judge it by.
Ask if they know the difference between your two buyers — a comms lead who wants speed and design, and a developer who wants a clean API — because a plan that treats them the same will underperform for both. Ask how they'd position you against a full BI suite without scaring off enterprise buyers or boring self-serve ones. Then check ownership: your site, ad accounts, and chart gallery should live in your name, not the agency's.
Google Ads usually produces the first trials within a few weeks, since intent on searches like “chart maker” is already high. Rankings for comparison and “alternatives to” terms take about 3–4 months to build, with organic leads following by month 6 to 8. Onboarding email starts lifting your trial-to-paid rate immediately, because it's working the trials you've already won, not waiting on rankings.
We run the whole system — site, Google Ads, SEO, AI search, and lifecycle email — under one roof, so a comms-team landing page and a developer-facing docs page are never built by two different vendors with two different opinions of your brand. Pricing is public, there's no long-term contract, no setup fee, and your site, ad accounts, and customer data are yours from day one.
The starting price for every service is already public on the pricing page, so there's nothing to negotiate to find out. What changes proposal to proposal is scope — how many landing pages your two buyer types need, and how competitive your comparison keywords already are. Tell us about your tool and a priced plan lands in your inbox within one business day.
Trials, published charts, and paying accounts — a session count on its own doesn't pay anyone's salary. Landing pages and CTAs are built around getting someone from a blank canvas to a finished chart, and every trial gets traced back to the campaign or article that produced it, so you know your real cost per paying account.
Yes — most companies in this category sell some mix of both, and the two buyers decide differently. For no-code chart and infographic tools we build the self-serve funnel: a live gallery, plain pricing, and onboarding that gets a first chart published fast. For embeddable libraries and APIs we go after developers with docs-adjacent SEO, GitHub- and comparison-shaped content, and a trial path built around a technical evaluation, not a sales call.
Yes. Your site, chart gallery, brand assets, ad accounts, and customer data all live in accounts your company controls. We're month-to-month with no long-term contract, so if you ever leave, everything simply stays exactly where it is.
Yes. Trials and demo requests can flow into HubSpot, Salesforce, or whatever CRM your team already runs, so a signup from a comms lead or a developer shows up in the same pipeline sales already works from — no manual exports.
Most data visualization product sites and landing pages, chart gallery included, go live in about 2 to 4 weeks. The pace mostly depends on how fast we get real sample charts, product screenshots, and your feedback — you'll have a clear timeline before we start.
Free Proposal
Let's get your next trial published.
Tell us about your tool and which buyer you're chasing — we'll map the pages, campaigns, and emails to fix it, with real pricing attached, not a placeholder range.
- A scoped plan priced against our public rate card
- A free look at where your funnel loses trials before they publish
- A real specialist replies within one business day — no bot, no queue
Month-to-month. You own your website, your ad accounts, and your data — always. Or call (519) 930-8818.
Request your free proposal.
Tell us about your tool and which buyer you're chasing — comms teams, developers, or both. You'll get a scoped, priced plan and a free look at your funnel within one business day. No pressure, no obligation.